Coobi
Designing for behavior change by making physiological and emotional patterns visible
01 — Overview
Coobi is a digital therapeutic platform exploring how physiological signals (HRV) and behavioral inputs can support addiction recovery.
I led the design of the Trends & Insights experience. This involved translating complex, multi-dimensional data into interpretable patterns that support reflection and behavior change.
HRV
Mood & journal
Input
Trends & Insights
I led thisPattern recognition
User insight
Behavior change
Outcome
The Problem
Lots of data was being collected in isolation. Without a unified view, users would have no way to connect signals or understand what their data meant for their recovery.
Heart rate variability
Sleep quality
Emotional states
Daily reflections
KEY GAPS IDENTIFIED
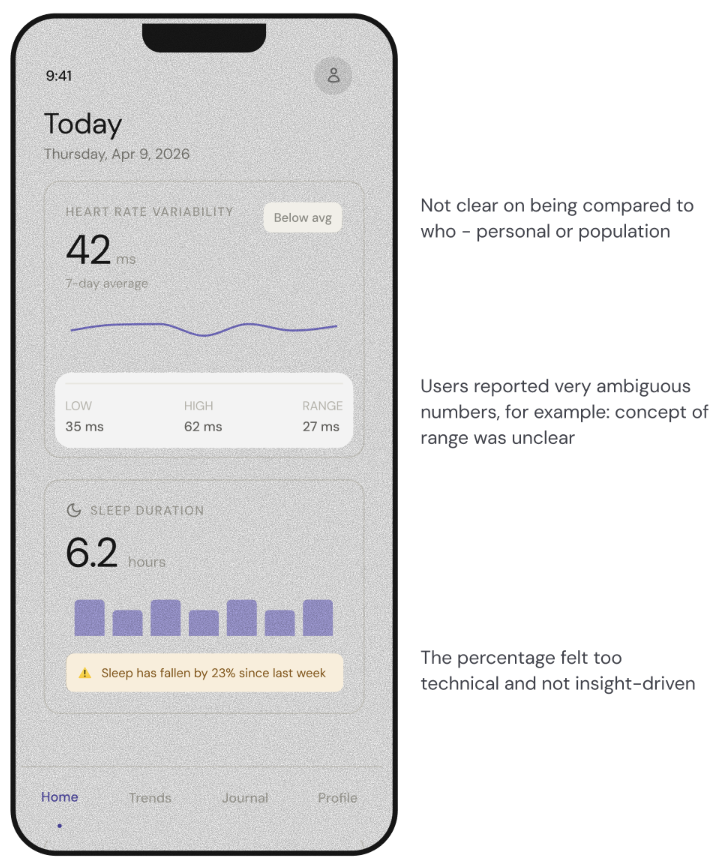
Fragmented data
Each metric lived in isolation with no unified view
Numbers, not patterns
Users saw raw values but couldn't extract meaning
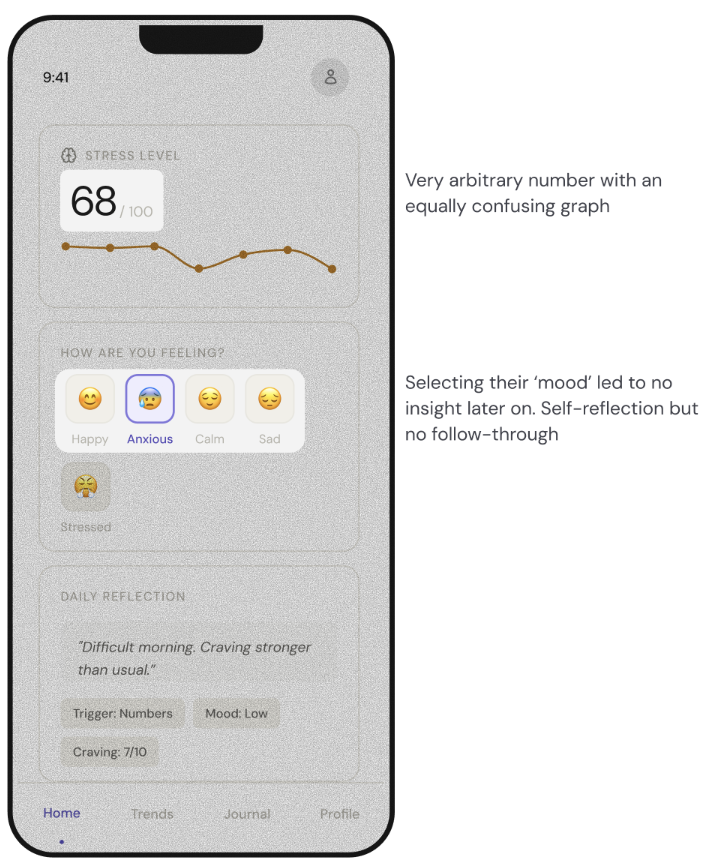
No clear connection
Body signals, emotions, and behaviors felt unrelated
Why this matters
In addiction recovery, awareness is the first step toward change.
Coobi collected extensive physiological and behavioral data, yet users found it difficult to understand the practical implications. The primary challenge was not gathering the information but making it meaningful.
Since people process patterns rather than individual data points, focusing on trends reduces mental effort. This approach makes it easier to link factors like stress, sleep, and mood over time. Consequently, the project shifted its focus to designing for pattern recognition instead of simple data display.
WITHOUT INTERPRETATION
WITH INTERPRETATION
02 — Research & Insights
What we learned
Users think in patterns
Not isolated data points. HRV = 72 is meaningless without context over time.
COGNITIONEmotion + physiology are disconnected
Users couldn't link "I felt stressed" with "my HRV dropped" — two worlds, no bridge.
MENTAL MODELToo much data overwhelms
More metrics without context → disengagement. Too little context → confusion.
COGNITIVE LOADFeedback tone is critical
In recovery contexts, data can motivate or trigger shame. Design must support, not evaluate.
SENSITIVITY03 — Design Direction
Make behavioral data interpretable, actionable,
and emotionally safe?
DESIGN APPROACH
How do we show data?
How do we help users understand themselves through data?
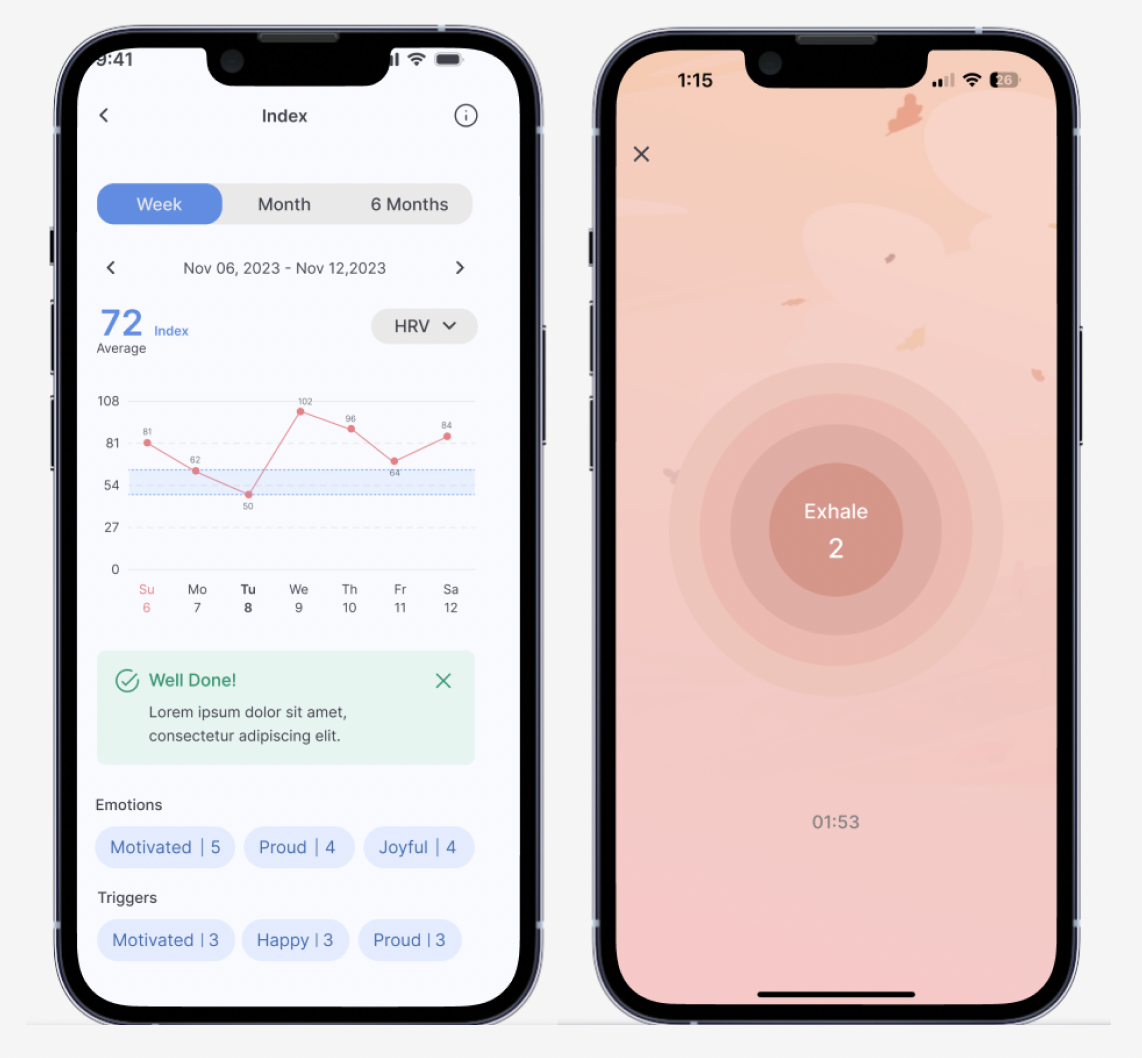
04 — Final Prototype
05 — Reflections
Designing for Sensitivity
I learned how to translate clinical CBT content into approachable and empathetic interfaces, making sure the language and flow felt supportive rather than overwhelming for users in recovery.
Feedback to Function
Weekly sprints and feedback loops taught me the value of iteration. Each round of refinement strengthened usability while keeping therapeutic relevance at the core.
Psychology + UX
This project deepened my ability to combine research insights with design choices, reinforcing my confidence in creating digital tools that are both impactful and clinically meaningful.
Visualizing Emotions
Through mood boards and sketches, I explored how color, tone, and layout could mirror the emotional journey of users. This helped me design an experience that felt safe, motivating, and relatable.
FIN.
